Tina Donati is the Head of Marketing at Simple Bundles and has spent the past 7+ years helping Shopify brands streamline their tech stack and unlock growth through smarter product bundling, better UX, and cleaner ops.
bundle strategy
How to track performance of your product bundles
Learn why bundle analytics are harder to track than regular product analytics in Shopify and the key metrics brands should monitor. Discover practical ways to track performance through SKU-matching exports, built-in bundle analytics, AI-assisted analysis, Bundle Magic, and promo code attribution.
Tina Donati is the Head of Marketing at Simple Bundles and has spent the past 7+ years helping Shopify brands streamline their tech stack and unlock growth through smarter product bundling, better UX, and cleaner ops.
Bundle analytics get messy.
Maybe the customer bought a skincare routine, a coffee sampler, a 3-pack of candles, or a build-your-own box. On the storefront, it felt like one intentional bundle. In your reports, it might show up as three separate products, one discount code, and no clear answer to the question you actually care about.
To understand whether your product bundles are actually increasing revenue, AOV, and repeat purchases, you need analytics that connect the front-end offer to the back-end reality.
Here’s what to track, where Shopify reporting falls short, and how to get clearer bundle performance data.
Why bundle analytics are harder than regular product analytics
Tracking a regular product is straightforward. A customer buys a product. Shopify records the SKU, quantity, sales, discounts, returns, and inventory movement.
Bundles are more complicated because one bundle can involve multiple layers:
The parent bundle product.
The individual component SKUs inside the bundle.
The discount or offer attached to the bundle.
The customer’s selected options.
The fulfillment breakdown your warehouse or 3PL needs.
The inventory impact across each child product.
If those layers aren’t connected properly, your reporting gets fuzzy.
In many setups, the bundle has a parent item that shoppers recognize on the storefront, while the actual fulfillment logic depends on component items or child products behind the scenes. That split is exactly why bundle tracking gets complicated. Your storefront may show one offer, but your sales data may be spread across multiple SKUs, product combinations, and line items.
For example, say a customer buys a “Complete Hair Care Routine” that includes shampoo, conditioner, a treatment mask, and a styling cream.
Depending on your bundling setup, Shopify may see that order as four individual products purchased together with a discount.
Most Shopify bundling apps make it difficult to track performance at the bundle SKU level because they add individual products to the cart instead of creating a true bundle product. When shoppers purchase the items, the order looks like a group of single-item purchases instead of one bundle.
The opposite setup creates its own problem.
If your app only places a single bundle SKU in the cart, it may be easier to track bundle revenue, but harder for your packing team to see the individual items inside the bundle. It can also make inventory harder to manage if the app does not sync stock at the component level.
So brands usually end up stuck between two bad options:
One setup gives you clean fulfillment but unclear reporting.
The other gives you clean reporting but messy fulfillment.
That is why the best bundle reporting does not stop at revenue. It helps you understand how the bundle performed, what was inside it, how it affected AOV, and what happened operationally after the order came in.
Essential metrics to track for product bundles
Before you can improve your bundle strategy, you need to know which metrics actually matter. Here are our suggestions to get the complete picture on bundle performance:
Bundle sales volume and revenue
How many bundles did you sell? How much revenue did those bundles generate?
This helps you understand immediate demand. If a bundle is barely selling, you need to know whether the issue is the offer, the placement, the price, the products inside it, or the audience seeing it.
Revenue is especially important when bundles are designed to increase average order value. A bundle may have a lower conversion rate than a single product, but still drive more revenue if the order value is meaningfully higher.
The key is making sure your reporting can separate bundle revenue from regular product revenue. If a bundle appears only as separate components in your order data, you may need to manually reconstruct performance unless your bundling app or Shopify reports can identify the bundle relationship.
Beyond top-line revenue, many brands also want cleaner sales reports that show bundle performance by SKU, bundle net amount, and even base sales price before discounts are applied. That level of detail makes it easier to compare bundles against standard products and understand how price bundling affects revenue over time.
Average order value lift
One of the biggest reasons brands create product bundles is to increase AOV.
But you do not just want to know your storewide average order value. You want to know whether orders with bundles are worth more than orders without bundles.
That means tracking:
Average order value for orders that include a bundle.
Average order value for orders that do not include a bundle.
AOV lift from bundle orders.
This is also helpful when comparing bundle types. A fixed kit, mix-and-match bundle, multipack, and build-your-own-bundle may all increase AOV differently.
For many merchants, this is where product bundles prove their value most clearly. If a bundle consistently raises average order value, or AOV, it is usually doing more than just packaging products together. It is improving cross-selling and upselling by encouraging customers to buy a more complete solution in one order.
Bundle penetration rate
Bundle penetration rate tells you what percentage of total orders include a bundle.
This is one of the clearest ways to understand whether your bundles are becoming a meaningful part of your business or staying as a small side offer.
For example:
If 3% of orders include a bundle, bundles may still be a niche upsell.
If 20% of orders include a bundle, bundles are becoming a core part of how customers shop.
If that number keeps rising, your bundle offers are likely resonating with a broader audience.
This metric is especially useful when you are testing new placements, such as homepage features, product page upsells, cart offers, email campaigns, or post-purchase promotions.
Bundle take rate
Bundle take rate measures how often customers accept or choose a specific bundle offer when they see it.
This is slightly different from bundle penetration rate.
Penetration rate looks at bundles across all orders. Take rate looks at performance against exposure.
For example, if 1,000 shoppers view a product page upsell and 120 add the bundle, the take rate is 12%.
This is helpful for understanding whether the offer itself is compelling. A low take rate might mean the products do not make sense together, the discount is not strong enough, the bundle is placed too low on the page, or the messaging does not make the value clear.
Best-performing bundle
At some point, you need to know which bundle is actually winning.
This is not always the bundle with the most revenue. Your best-performing bundle might be the one with the highest conversion rate, highest AOV lift, strongest repeat purchase behavior, or best margin.
For example, a lower-priced starter kit may sell more units, while a premium routine bundle may drive more revenue and profit.
Tracking your top bundles helps you decide what to promote more heavily, what to turn into a permanent offer, and what to retire.
Combination popularity
For mix-and-match bundles, build-a-box experiences, and build-your-own-bundle offers, the bundle itself is only part of the story.
You also need to know what customers are choosing inside the bundle.
Which flavors get picked most often?
Which shades are usually paired together?
Which products show up in the most profitable combinations?
Which items are rarely selected?
This kind of insight is also one of the clearest windows into customer behavior. The most popular product combinations can show you what shoppers naturally want to buy together, which makes them useful not just for merchandising, but also for future cross-selling, upselling, and campaign planning across different sales channels.
Profit margin
Revenue does not tell the whole story.
A bundle can look successful in Shopify and still create margin problems if the discount is too steep, shipping costs increase, or customers choose low-margin combinations.
For fixed bundles, margin is usually straightforward. You know the cost of goods for the products inside the bundle, you know the discount, and you can make sure the offer remains profitable.
For build-your-own-bundle experiences, margin tracking can get more nuanced.
Customers may be choosing from products with different cost profiles. One combination may be highly profitable. Another may barely clear your margin threshold. If your bundle allows too much flexibility without guardrails, your most popular combination may not be your most profitable one.
If your individual products are profitable, the main rule is simple: do not discount the bundle so heavily that the combination loses money.
Your bundle analytics should help you understand not just what sold, but whether the offer was worth it.
Repeat purchase rate
Some bundles are designed to introduce customers to more products, increase product discovery, and create better second-purchase behavior.
This is especially important for categories like beauty, food and beverage, supplements, pet products, apparel basics, and consumables.
If customers who buy bundles return more often, buy more products later, or subscribe at a higher rate, that bundle may be doing more for your business than the first order suggests.
Track how often bundle buyers return to make another purchase, and compare that to customers who only bought one product.
A strong repeat purchase rate can signal that your bundle is helping customers find products they like faster.
Abandonment rate
A shopper may love the idea of a build-your-own box, but abandon it if there are too many choices. A customer may add a bundle to cart, then hesitate when they see the final price. Another may start customizing a bundle but never complete the selection.
That is why abandonment rate matters.
High abandonment may point to:
Too many required choices.
Unclear savings.
Confusing bundle rules.
Weak product combinations.
A price point that feels too high.
Missing product images or descriptions.
A bundle that performs poorly is not always a bad idea. Sometimes it just needs a better structure.
Reviews and customer feedback
Bundle analytics should include qualitative feedback too.
Bundle reviews, support tickets, post-purchase surveys, and return reasons can all help explain what your numbers cannot.
For example, customers may love the value of a bundle but complain that they could not swap one item. Or they may buy a discovery kit, then mention in reviews that it helped them find a new favorite product.
This feedback can help you decide whether to create more flexible bundles, simplify options, change product pairings, or improve the way the bundle is explained on the product page.
Stock levels and inventory impact
A bundle can only perform if the products inside it are available.
That is why inventory reporting matters just as much as sales reporting.
If a bundle depends on three child SKUs, one out-of-stock component can break the entire offer. And if your bundling app does not sync inventory correctly, you may keep selling bundles that your team cannot actually fulfill.
For every bundle, you should be able to understand:
Which component SKUs are included.
How many units of each component are available.
Whether bundle inventory is calculated from child product inventory.
Which bundle is at risk of going out of stock.
How bundle sales affect individual product stock.
This is especially important if you work with a 3PL, WMS, ERP, Shopify POS, or multi-location fulfillment setup. Because bundle logic eventually flows into picking lists, packing slips, and sales order confirmations. If the bundle is not mapped correctly to its component items, warehouse teams may struggle to fulfill it accurately, even if the storefront experience looks clean.
How to track bundle performance without built-in analytics
If you don’t currently have a clean analytics dashboard, there are a few different ways you can understand bundle performance before you move to a more complete reporting setup.
The SKU-matching order export method
Most ecommerce platforms and Shopify apps let you export order data to a CSV file.
If your bundle is made up of individual SKUs, you can use that order export to identify when those products were purchased together.
The strategy is simple:
Export your order data.
Filter by the SKUs included in the bundle.
Group products by order ID.
Count how many times those SKUs appeared together in the same order.
This gives you a rough count of bundle sales over a selected period, even if your analytics dashboard does not recognize the bundle as one offer.
Using a Shopify bundling app with analytics built in
The cleanest option is to use a bundling app that has analytics built in.
This is especially helpful if you want reporting on bundle revenue, number of bundles sold, top-performing bundles, and AOV impact without manually rebuilding your data in spreadsheets.
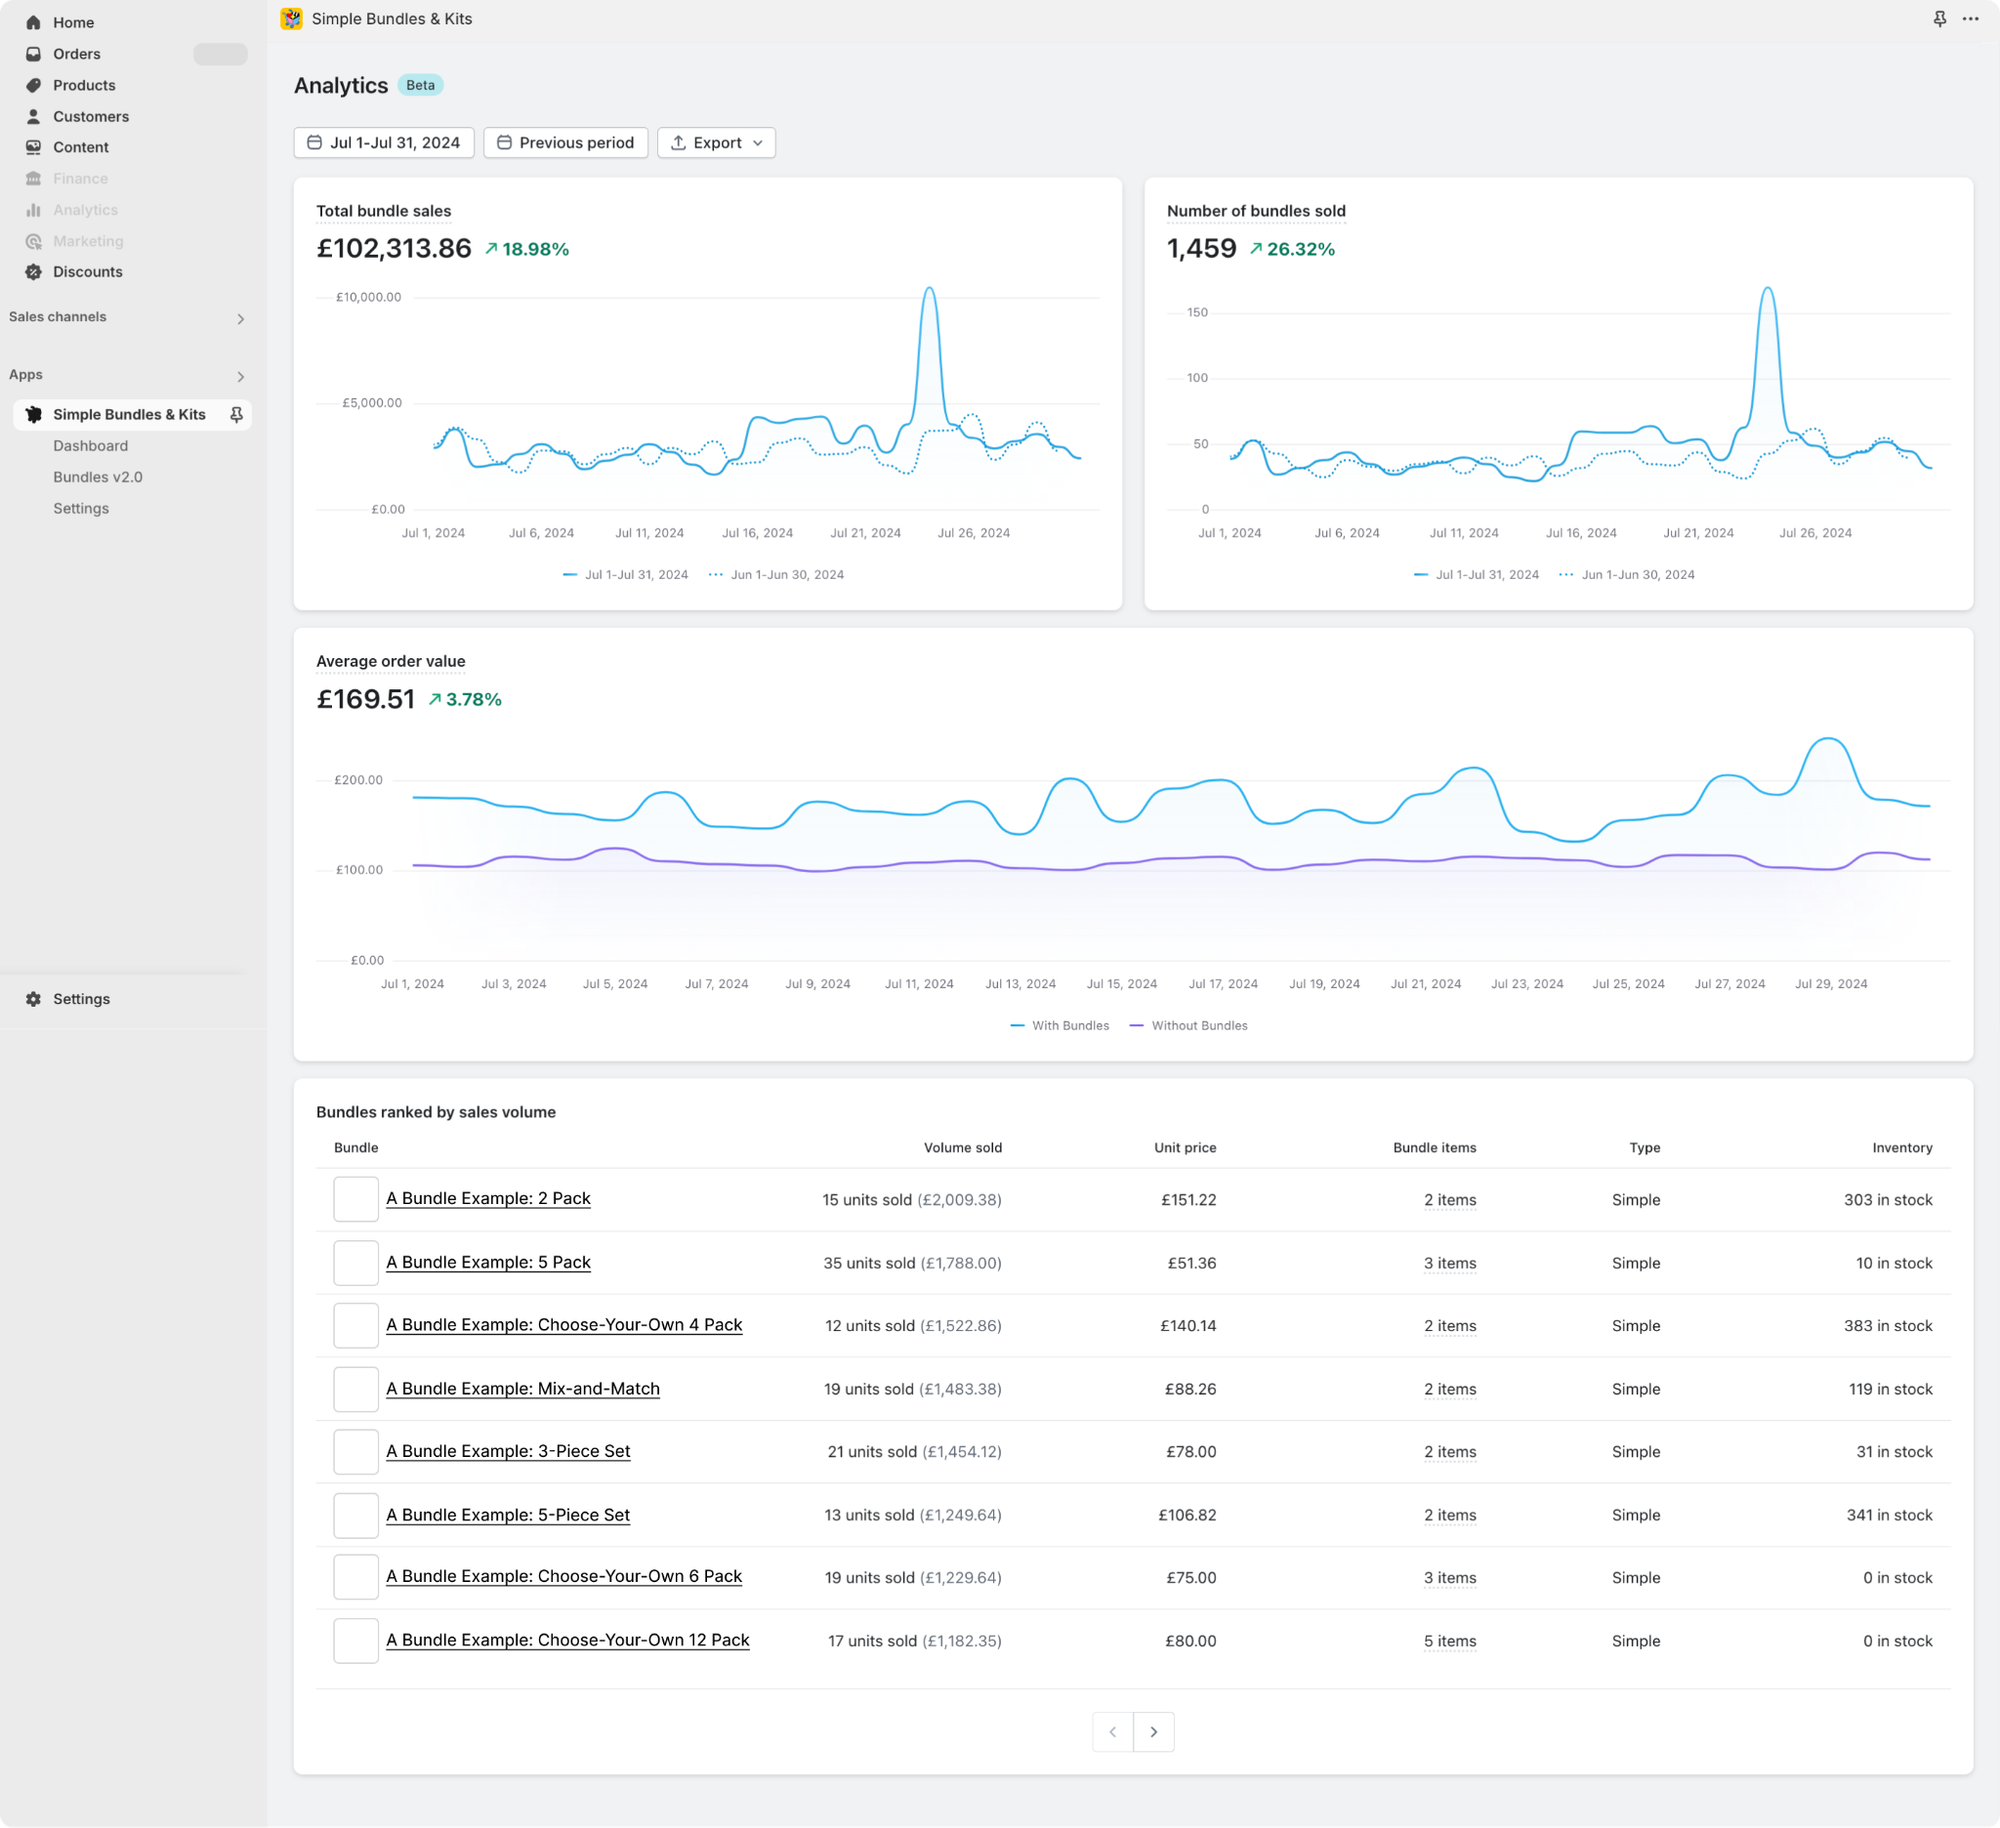
Simple Bundles includes an analytics dashboard that helps you understand how your bundles are performing.
Inside the dashboard, you can track:
Total bundle sales.
Number of bundles sold.
Average order value.
Top-selling bundles.
Exportable order data for orders containing bundles.
Total bundle sales are calculated as gross sales minus returns, giving you a clearer view of the revenue your bundles generated.
Simple Bundles is especially useful because it is designed to support both reporting and operations. You can sell bundles in a way that makes sense to customers while still breaking them down into the individual SKUs your fulfillment team, 3PL, WMS, or ERP needs.
That means you do not have to choose between analytics and fulfillment. You can track the bundle as a bundle, while still syncing inventory at the component level.
Learn more about how Simple Bundles’ analytics work here.
Using AI to analyze bundle performance
You can also use AI to analyze anonymized Shopify order exports.
This works best when you have clean order data and remove any sensitive customer information before uploading the file.
For example, you could use a prompt like this:
Analyze this anonymized spreadsheet of recent Shopify orders. Step 1: Find products frequently purchased together in the same order. Step 2: Look for items commonly bought as a second purchase within 30 days of the first. Step 3: Identify patterns in high-value or high-frequency product pairings. Step 4: Recommend 3 bundle ideas with suggested names, price points, and explanations of why they would work well together. Format results as: Bundle name → Items → Price → Why it works.
This approach can help you find bundle opportunities, understand common product pairings, and identify which combinations may deserve more promotion.
It can also help you answer questions like:
Which products are often purchased together?
Which combinations show up in high-value orders?
Which first purchases lead to strong second purchases?
Which products should be turned into curated kits?
AI does not replace accurate Shopify reporting, but it can speed up the decision-making process when you are working with raw exports.
Option 2: Simple Bundles’ Bundle Magic
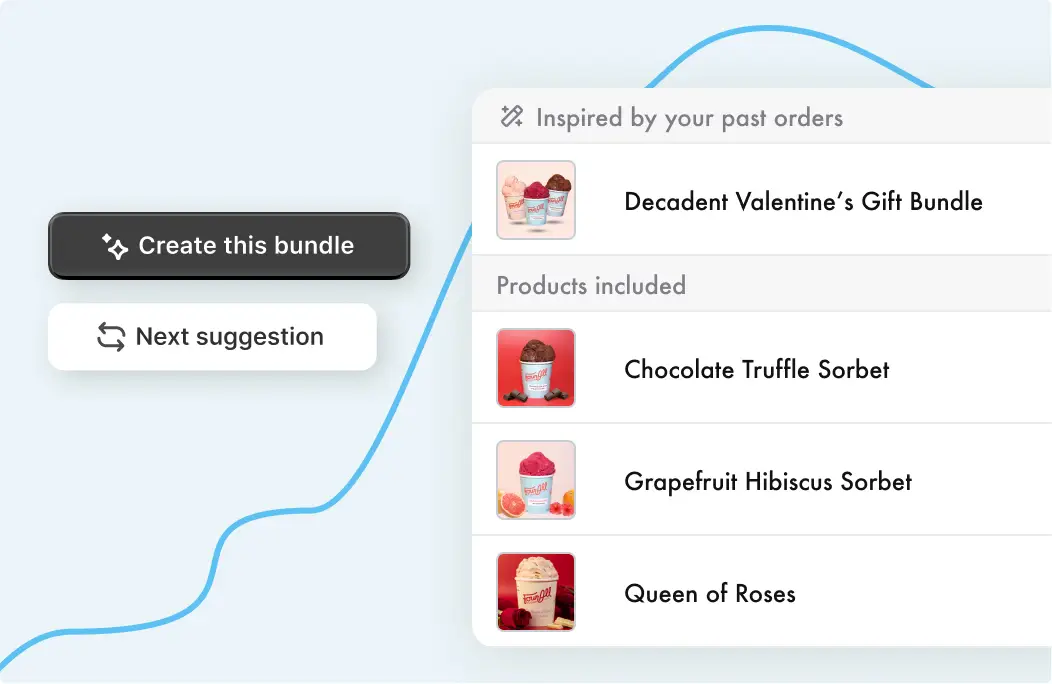
Bundle Magic is a Simple Bundles feature that does the spreadsheet work for you. It analyzes your order history using ai-powered algorithms and generates bundle suggestions based on actual purchase patterns.
But it goes beyond simple "frequently bought together" logic. The AI applies intelligence about sensible product combinations, factoring in customer segments, customer behavior, and even indirect relationships between related items.
This means you might see suggestions for complementary items that don’t always appear together but make sense based on broader patterns in your store.
When Bundle Magic generates a suggestion, it doesn't just tell you what to bundle. It creates a complete Shopify product for you:
AI-generated title and description based on built-in product recommendations logic
Combined product imagery so you have a visual starting point
Suggested pricing based on the individual product prices
This is automated bundling designed to streamline your workflow and improve your customer experience.
Custom promo code attribution
If your bundle uses a discount, you can also track performance with a dedicated promo code.
For example, you might create a code like PERFECTPAIR or ROUTINE10 that is used only for one bundle campaign.
Then simply track how many times the code is used at checkout.
This gives you a clean count of redemptions tied to that specific offer.
The limitation is that promo code reporting does not always tell the full story. It may show how many times the code was used, but not whether customers abandoned the bundle, what items they selected, how the bundle affected AOV, or whether the order remained profitable.
Track bundles as bundles without breaking fulfillment
Product bundles should be easy for customers to buy, easy for your team to fulfill, and easy for your business to measure.
That only works when your bundle setup connects the storefront experience to the operational backend.
Simple Bundles helps Shopify brands create product bundles, multipacks, mix-and-match bundles, build-your-own-bundle experiences, BOGO offers, free gifts, and volume discounts while keeping inventory, fulfillment, and reporting clean.
Frequently asked questions
Which Shopify apps offer bundle analytics like attach rate, AOV lift, and repeat purchase?
If you are comparing Shopify bundling apps, look for one that can report on more than just whether a discount was used.
Simple Bundles gives brands built-in bundle analytics, exportable bundle order data, and access to Shopify bundle reports. For teams that need more advanced reporting, Simple Bundles can also be paired with custom reporting through Report Toaster.
That makes it a strong option for brands that want to understand bundle revenue and performance without losing the operational detail needed for bundle inventory and fulfillment.
How do you track bundle performance in Shopify?
You can track bundle performance in Shopify by looking at bundle sales, AOV lift, bundle penetration rate, bundle take rate, top-selling bundles, repeat purchase rate, and bundle margin.
If your bundling app creates clear bundle data, you can use app analytics and Shopify reports. If your app only adds individual products to the cart, you may need to export order data and manually identify which SKUs were purchased together.
How do you measure AOV lift from product bundles?
To measure AOV lift from product bundles, compare the average order value of orders that include bundles against orders that do not include bundles.
For example, if non-bundle orders average $65 and bundle orders average $92, the bundle AOV lift is $27. This helps you understand whether bundles are increasing order value or simply changing which products customers buy.
Which bundling apps for Shopify have the best reporting on bundle revenue and margins?
To understand bundle performance properly, you need to see both sides of the order:
The bundle as the customer purchased it.
The individual products your team needs to fulfill, restock, and analyze.
Simple Bundles is built for this balance. It lets you track bundle sales and top-performing bundles while still breaking orders down into child SKUs for fulfillment and inventory sync.
For revenue reporting, Simple Bundles provides an analytics dashboard with total bundle sales, bundles sold, AOV, top-selling bundles, and CSV exports.
Build a bundle in under 5 minutes
Over 25,000 Shopify merchants use Simple Bundles to sell more per order.
Learn how to choose between a discount app and a bundling app based on what you're trying to build. Plus, see how bundle pricing can work alongside Shopify discount codes, how to avoid accidental double-discounting, and why fulfillment should be part of the decision.
Stocky shuts down permanently on August 31, 2026. If you sell perishables, track batches or lots, manage expiry dates, or sell multi-SKU bundles, there are real gaps you need to plan around before the deadline.
Off-road and overlanding customers are buying complete upgrades for their rigs. This article explains why kit-based selling dramatically increases AOV for Shopify stores by packaging compatible components into pre-built kits or bundles.